
We’re passionate about helping you with all your Gradiometry needs

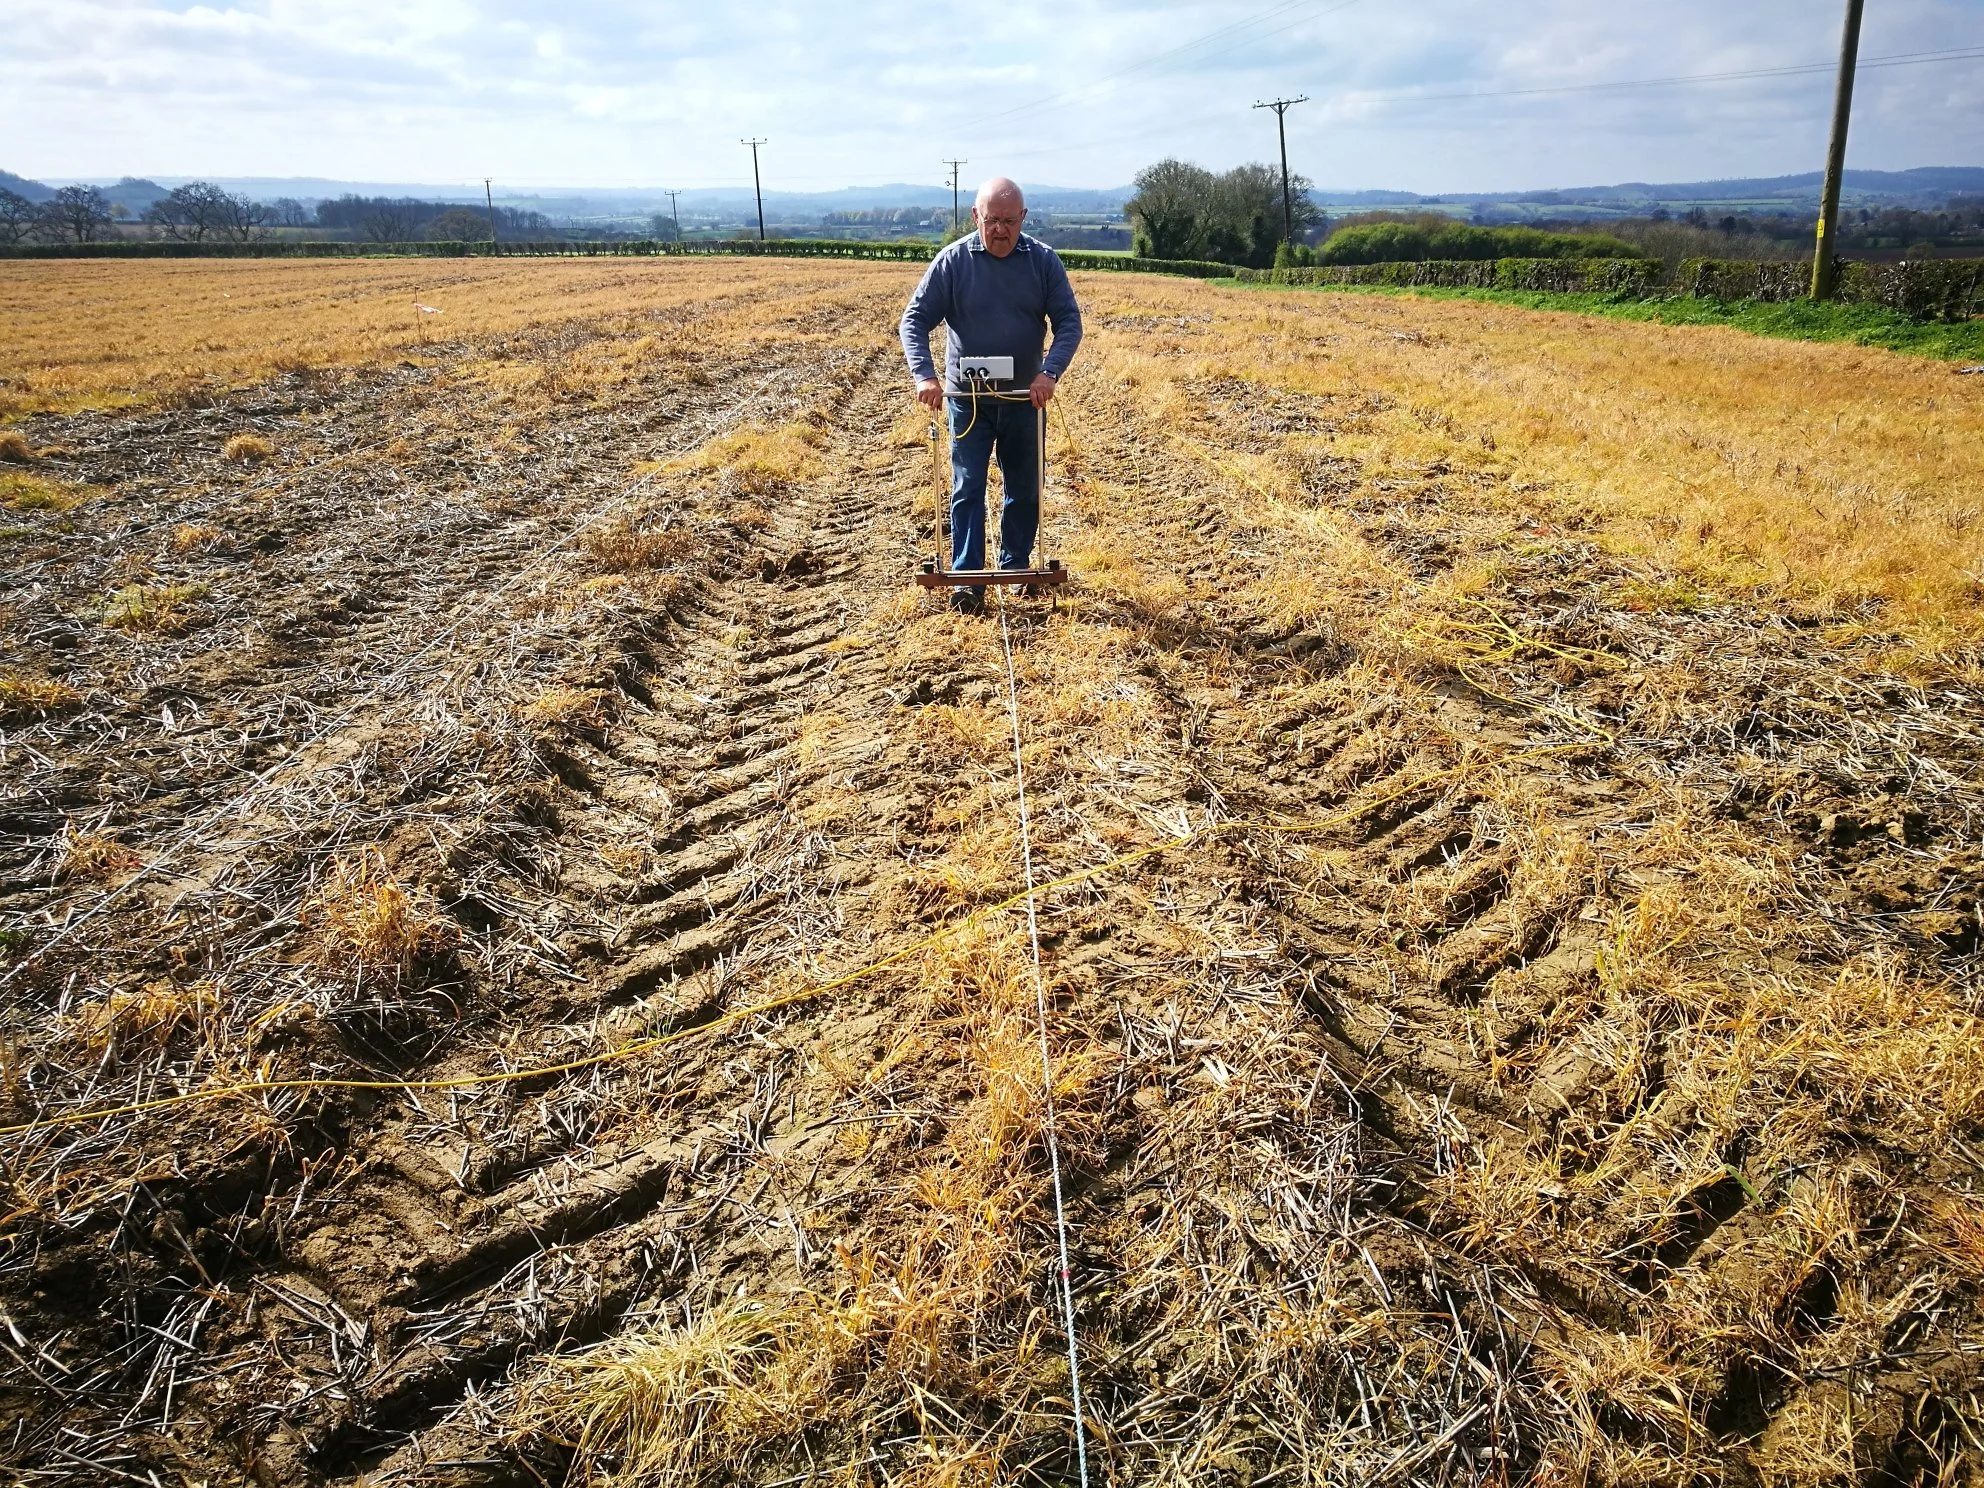
Gradiometry
GeoFlo use the Bartington Grad601-2 dual system fluxgate gradiometer. It comprises two sensor rods carried on a rigid frame, each sensor including two fluxgates aligned at 90° to each other, one set 1m above the other. It measures variations in the magnetic field between the two fluxgates, recorded in nanoTesla (nT) at each sampling point within a grid. The manufacturer claims a depth range of approximately three metres. The instrument is most effective when carried at a consistent height, not exceeding 0.3m above the ground.
Gradiometers are especially effective for discovering thoroughly decayed organic materials, such as those which accumulate in ditches and pits, and matter exposed to intensive firing, including industrial areas, hearths and larger ceramics. All of these are likely to give a positive magnetic response, sometimes with a negative halo, giving a dipolar effect. Non-igneous stone features, such as walls and banks, are usually perceived as negative anomalies against a background enhanced by decayed organics.
Data is stored using a built-in logger, then transferred directly to a computer via Bartington’s Datalog programme.
Processing
GeoFlo uses Geoscan’s Geoplot 4.0, which supports statistical analysis and filtering of the data. It allows the presentation of data in four graphical forms: dot-density, grey scale, pattern and X-Y (or trace) plots. The processing methods for gradiometer and resistivity data differ slightly.
Gradiometry Processing
Typically gradiometer data includes high ferrous magnetic readings due to pipelines or metal debris which can be filtered out. Thereafter small performance errors can be removed and mean values set to “0”, allowing a smooth data set. Further enhancement may be achieved by a range of processes, most frequently including the interpolation of additional data points or the application of a gaussian low pass filter.
Resistivity Processing
For resistivity, isolated high or low readings (noise spikes sometimes caused by a false contact) can be replaced by the mean reading. The technique is particularly susceptible to geological variations which may be reduced by the application of a uniform high pass filter. Weak anomalies may be highlighted by the application of a gaussian low pass filter and the data smoothed by interpolation,
Geophysical survey training days
Feedback from previous participants:
“The group of experts were all so enthusiastic, friendly and willing to share experiences… I felt like part of a real working team.”
“Many thanks for a great weekend. It’s always a pleasure working with you.”
“It was a great weekend… you certainly helped us really enjoy ourselves and get fired-up about archaeology.”
Resistivity
Surveys are conducted using Geoscan’s RM15 Resistance Meter, a standard twin probe mobile array, and two fixed remote probes. The meter consists of a constant current source transmitter and high input impedance receiver. This virtually eliminates errors due to contact resistance between the probes and the ground, and current ranges allow readings to be taken even in dry conditions. The mobile probes are fixed at 0.5m separation, and readings are normally taken at 1m in both the x and y axes, although detailed surveys at 0.5m pitch in the y axis can be undertaken on request.
Resistivity surveys are particularly useful in indicating shallow (on average up to 0.75m) buried archaeological features. They are often more effective than gradiometry for detecting stone buildings or floors and in many circumstances will detect ditches and substantial pits. Initial filtration is applied at the data input stage to mitigate the “noisy” effects of residual mains electrical earth currents and local geological variation.


Reports
Geophysical survey reports are prepared by Liz Caldwell PIFA, and include information about the survey method, processing sequence of the raw data, detailed graphics of the survey plot and interpretation graphics.
